|
|
|
|
Planters
Products
Members
Market Data
News
Ag Commentary
Weather
Resources
|

Chart of the Day - December Soybean Oil
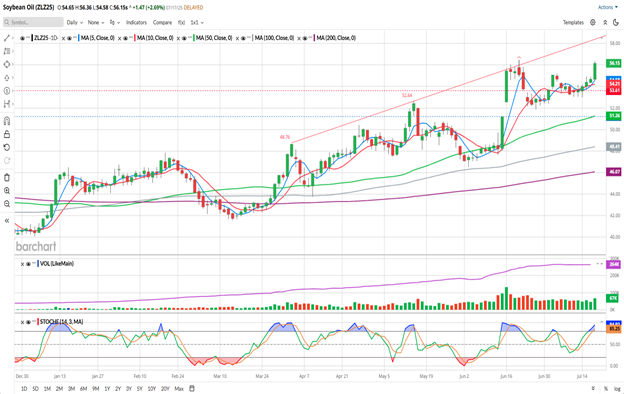
The information and opinions expressed below are based on my analysis of price behavior and chart activity Thursday, July 17, 2025 December Soybean Oil closes at 23-month highs If you like this article and would like to receive more information on the commodity markets from Walsh Trading, please use the link to join our email list -Click here Every morning, at about 8 AM CST, I post a short video highlighting where I see opportunities in the futures markets. You can view my most recent video here December Soybean Oil (Daily)
Today, December Soybean Oil settled at 56.15, up 1.47 from Wednesday. I think that the last time I wrote about Bean Oil in this space was on July 1st. You can find that article here, if you’re so inclined. At the time I was advocating for establishing long futures positions in Bean Oil for aggressive and well-margined traders, along with a December 55.00/60.00 Call Spread for those that may be a bit more risk-averse. The initial upside target in the futures that I mentioned was 56.47, which has not yet been hit, along with a risk/reverse stop level near 52.40, which has also not been hit. The 55.00/60.00 call spread was near 1.54 at that time and today those options settled at a difference of 1.96. We’ve seen some time-value erosion in the options, but both of those positions should still be working, if you chose to take either one. With today’s trade, the 5- and 10-day moving averages (blue/red) made a bullish crossover, which I normally use as a trade signal. They made a bearish crossover last week, but the market did not follow through to the downside. Today, those averages are at 54.58 and 54.22, respectively, and now may offer potential support. The close today was the highest since August 21, 2023, at 23 month highs. The 50-day average (green) is still inclined higher and is at 51.26 today, which is coincidentally close to the downside gap at 51.19. That gap is denoted by the blue horizontal line. The long-term averages on this chart, the 100 and 200 are also well below the market and inclined higher at 48.41 and 46.07, respectively. Trade volume was relatively high today at 67,129, the highest since June 25th. A strong move on higher volume typically means more price extension ahead, in my opinion. Stochastics (lowest sub-graph) have moved up into overbought territory over the past 2 sessions. Given the way the market is behaving, I would still recommend that aggressive and well-margined traders consider establishing long positions in the futures, although I think your protective stop should be much higher. Perhaps a risk near the 10-day average which is at 54.22 might be appropriate. On the chart above, you may notice the red trendline, drawn roughly from the early-April to mid-May highs. That trendline value is up near 58.50 today, which may be a reasonable target to the upside. For traders that prefer options, I would still advocate for that December 55.00/60.00 Call Spread, with a target at 2x what you paid for the spread. If you’d like a new or different strategy, please reach out to me directly. If you like what you’ve read here and would like to see more like this from Walsh Trading, please Click here and sign up for our daily futures market email. Every morning, at about 8 AM CST, I post a short video highlighting where I see opportunities in the futures markets. You can view my most recent video here December Soybean Oil (Weekly)
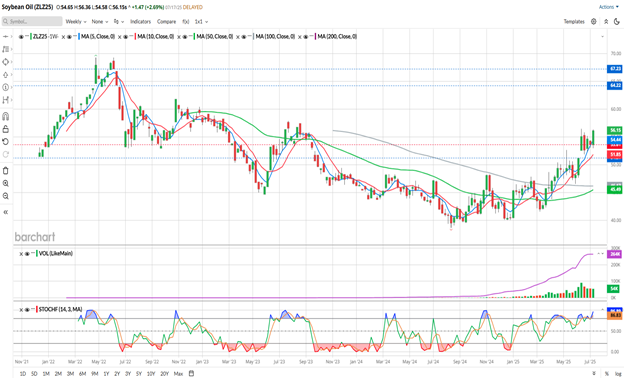
There’s still a day left in the trading week, but as of today’s close, December Bean Oil is up 2.50 (+4.66%) If the market were to remain unchanged tomorrow, that would mark the highest weekly close in this contract since the 2nd week of August 2023. It will take a weekly close above 57.90 to achieve new 2- year highs. This market has spent about 4 weeks in a consolidation type of pattern, going sideways basically, before resuming the upward momentum this week. The short-term averages on this chart, the 5- and 10-week (blue, red) are both below the market and pointing higher. To my eye, the 5-week average (54.44) has acted as support for the past three weeks, including this one. The 10-week is well below the market at 51.85, which, coincidentally, is just a couple of ticks below the low from 4 weeks ago. The 100-week and 50-week averages (grey, green) are also well under the market price, near 46.17 and 45.49, respectively. The 50-week is inclined higher and converging with the 100-week. If recent trends continue, those should make a bullish crossover in the next week or two, further making the case for the bullish side. This chart shows the entire life of the contract, a bit longer time frame than I normally choose to display. I did that to highlight the past highs and potential resistance levels. First possible resistance might be the 57.90 highs from July 2023. The next may be near 61.82, the high from October of 2022. I may be a bit optimistic, but I’ve also put the gaps from June of 2022 at 64.31 and 67.23, indicated by the blue horizontal line way up above. If you like what you’ve read here and would like to see more like this from Walsh Trading, please Click here and sign up for our daily futures market email. Every morning, at about 8 AM CST, I post a short video highlighting where I see opportunities in the futures markets. You can view my most recent video here Jefferson Fosse Walsh Trading Direct 312 957 8248 Toll Free 800 556 9411 jfosse@walshtrading.com www.walshtrading.com Walsh Trading, Inc. is registered as a Guaranteed Introducing Broker with the Commodity Futures Trading Commission and an NFA Member. Futures and options trading involves substantial risk and is not suitable for all investors. Therefore, individuals should carefully consider their financial condition in deciding whether to trade. Option traders should be aware that the exercise of a long option will result in a futures position. The valuation of futures and options may fluctuate, and as a result, clients may lose more than their original investment. The information contained on this site is the opinion of the writer or was obtained from sources cited within the commentary. The impact on market prices due to seasonal or market cycles and current news events may already be reflected in market prices. PAST PERFORMANCE IS NOT NECESSARILY INDICATIVE OF FUTURE RESULTS. All information, communications, publications, and reports, including this specific material, used and distributed by Walsh Trading, Inc. (“WTI”) shall be construed as a solicitation for entering into a derivatives transaction. WTI does not distribute research reports, employ research analysts, or maintain a research department as defined in CFTC Regulation 1.71. This article contains syndicated content. We have not reviewed, approved, or endorsed the content, and may receive compensation for placement of the content on this site. For more information please view the Barchart Disclosure Policy here.
|
|
|